Main branch analysis
Main branch analysis is your third line of defense in keeping your code clean (after SonarLint in your IDE and pull request analysis).
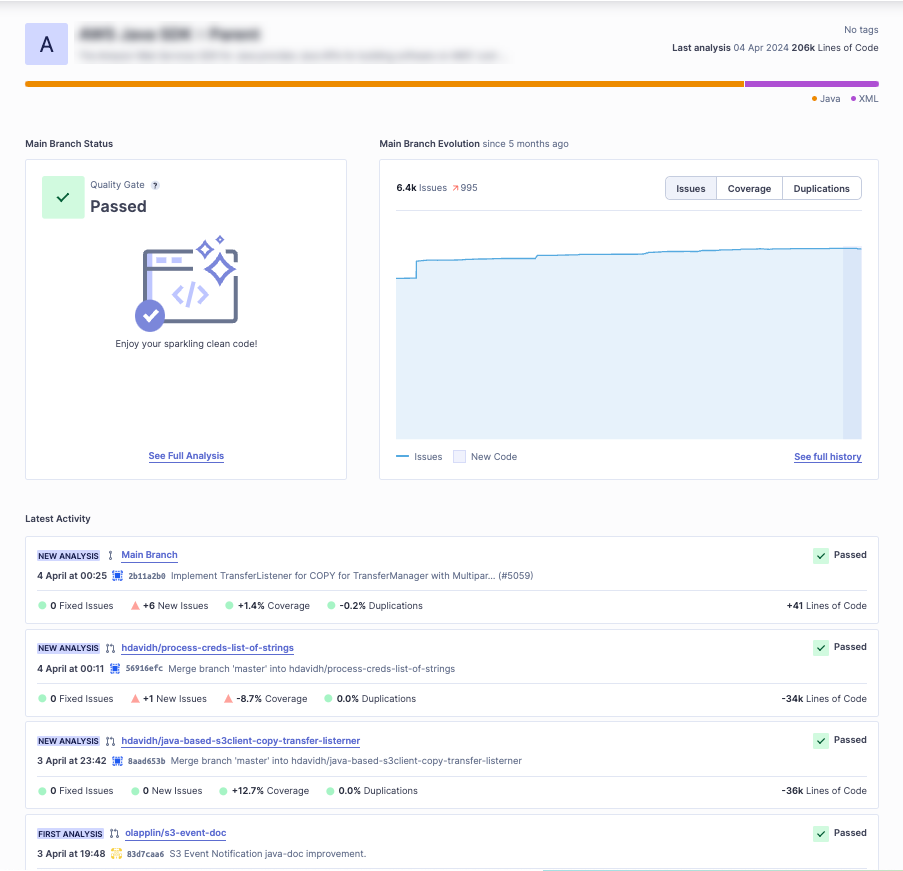
SonarCloud analyzes the main branch every time a change is made to it. Select My Projects in the global navigation and select your project from the list to see the results. By default, the Project Overview is displayed. This view includes three sections:
- Main Branch Status: The quality gate status of your main branch, Passed, Failed, or Not Computed.
- Main Branch Evolution: A summary of the code quality results for the main branch of your project.
- Latest Activity: A summary of recent analyses performed on your project.
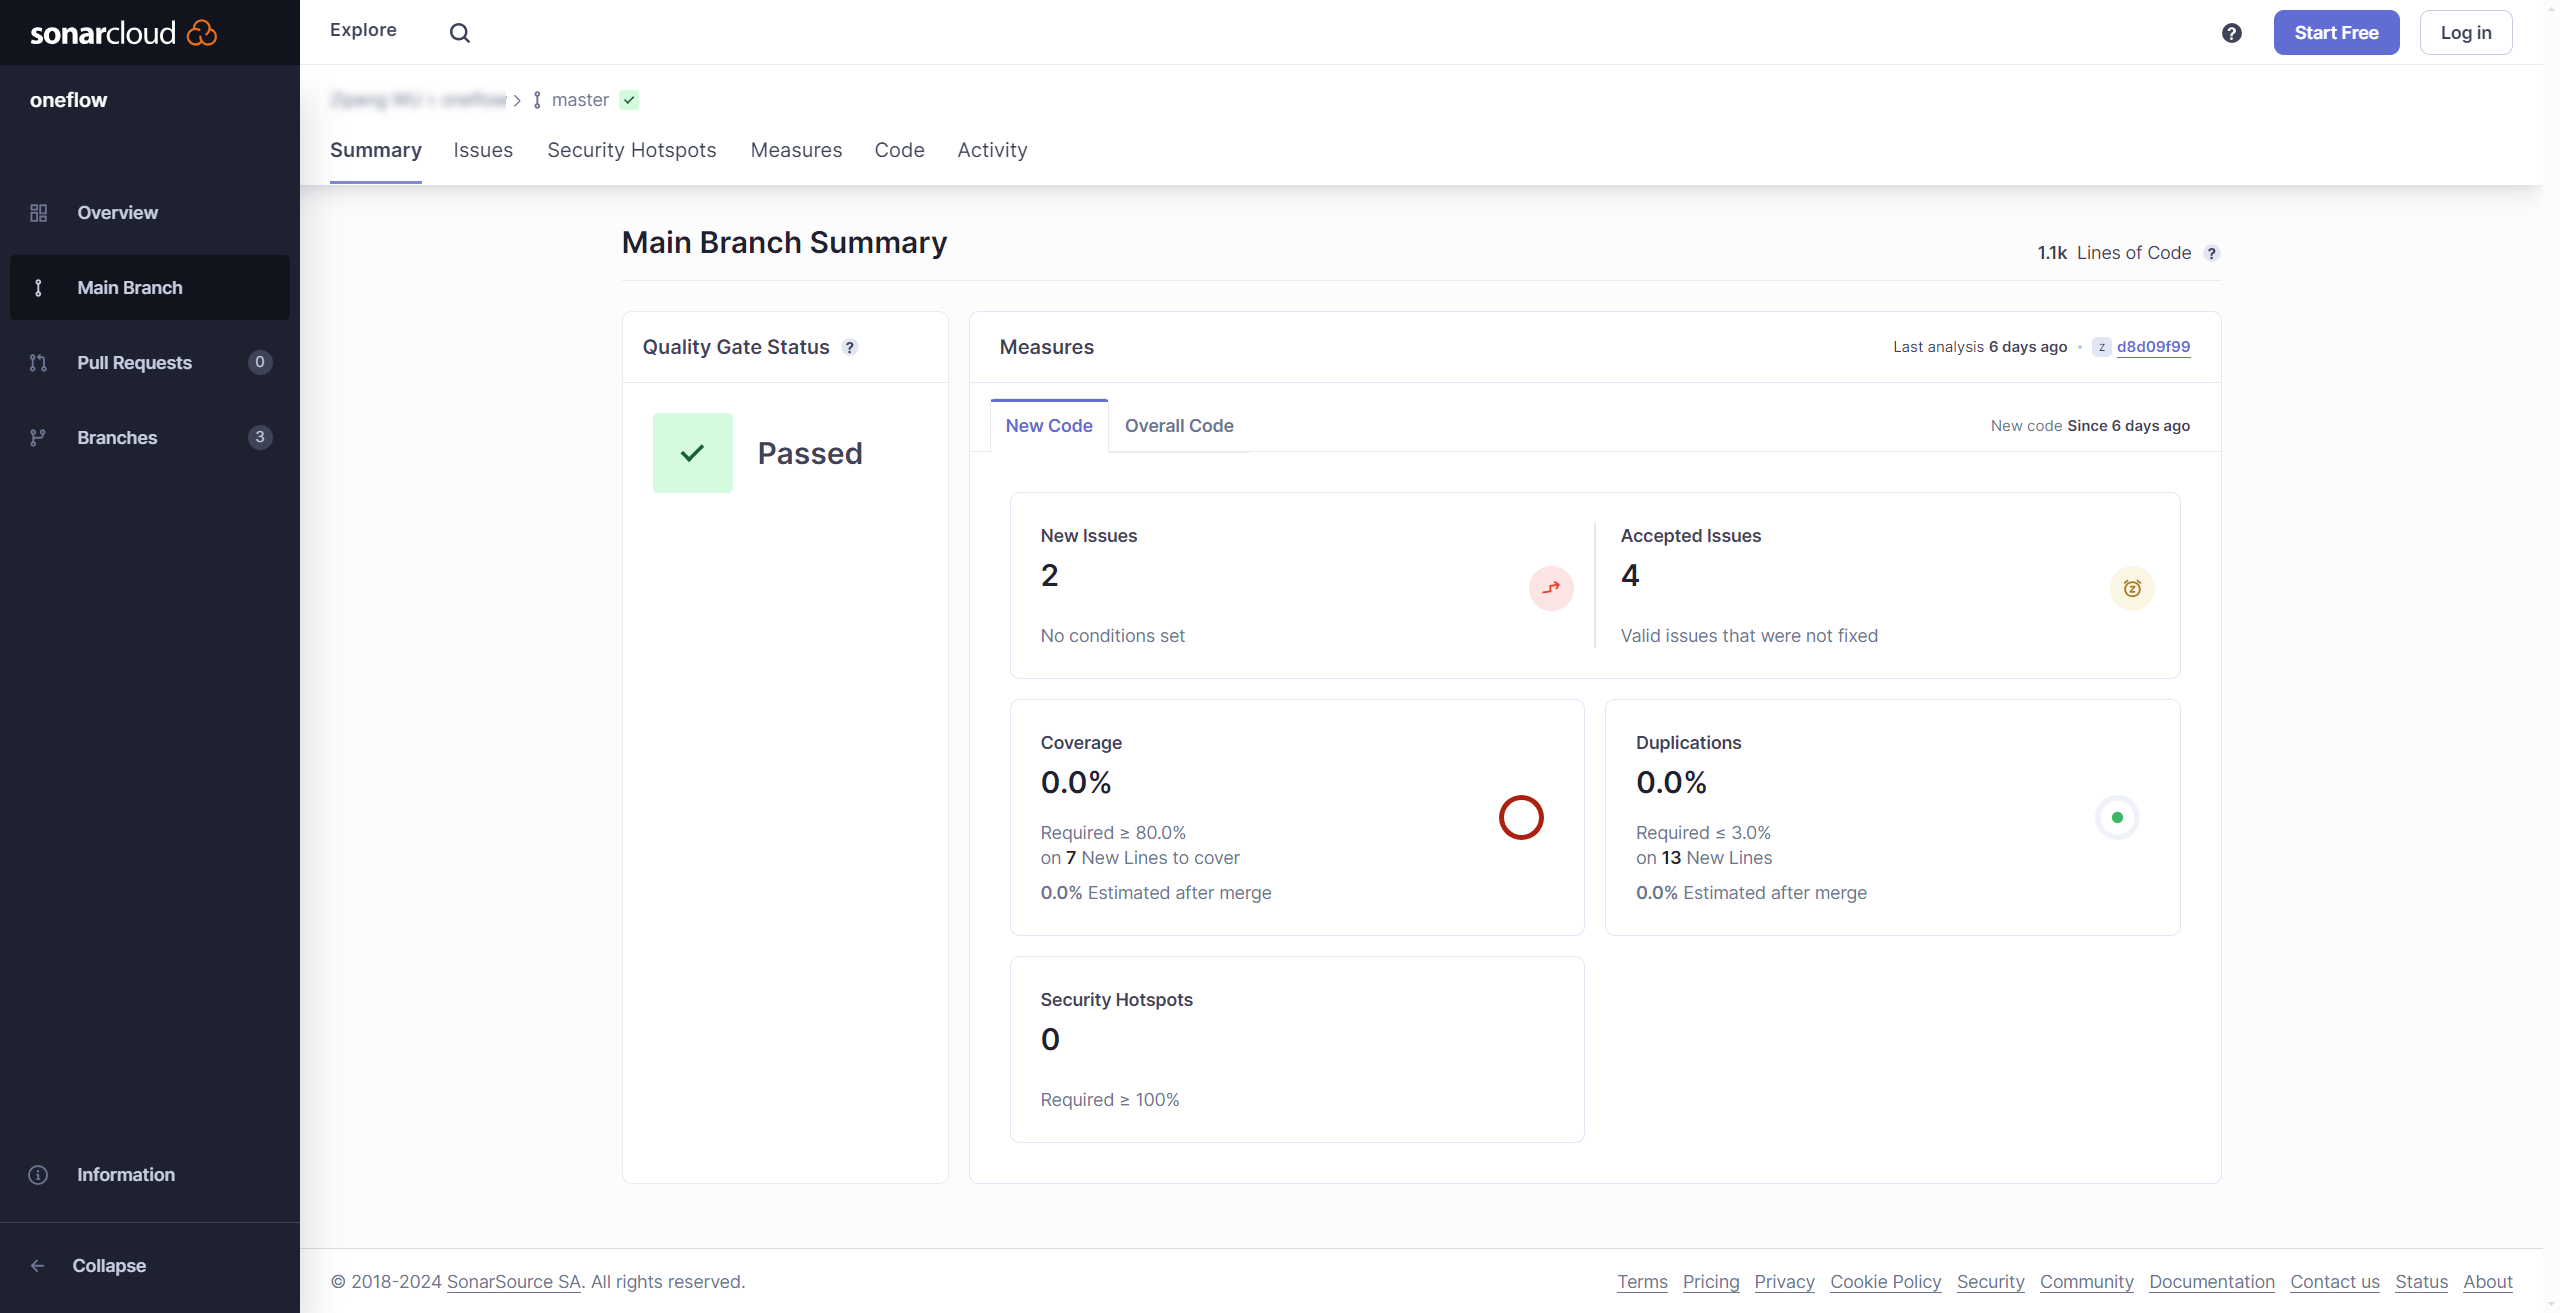
On the left side of the page, go to Main Branch to see a detailed breakdown of the results for the main branch of your project.
Quality gate
The quality gate status for your main branch is displayed under the Summary tab of the Main Branch view.
It shows the releasability status of the main branch of your project, answering the question, "Can I release my project today?"
A quality gate consists of a set of conditions like "Reliability is rated at least A", "Maintainability is rated at least B", and "Test coverage is at least 80%". These conditions are applied to analysis results to determine whether the code meets the level of quality required.
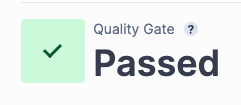
If the main branch meets or exceeds the quality gate conditions, it displays a Passed status:
If the main branch does not meet the quality gate conditions, it displays a Failed status:

Setting a new code definition
Initially, when you start a new project, you may end up performing an analysis without first setting a new code definition. Selecting a new code definition for your project is an essential part of setting up SonarCloud.
Without one, the default quality gate won't work. In this case, the system directs you to set up your new code definition, like this:

What counts as new code can differ from project to project, so SonarCloud provides a few options. We strongly encourage all users to choose a new code definition suitable for their project.
Once you have set up a new code definition and performed another analysis, the quality gate status should appear.
Built-in quality gate
SonarCloud provides a built-in quality gate (called the Sonar way quality gate) enabled on the main branch by default. This quality gate reflects SonarSource's recommended settings. However, your requirements may differ, so you may wish to define a custom quality gate. For details see the Quality gates page.
New code quality measures
When you first look at a newly analyzed project, it can be challenging to decide where to start fixing issues. To help with this, SonarCloud encourages you to focus your efforts on new code. This is why we encourage users to set a suitable new code definition for their project.
We refer to this practice as Clean as You Code. The Clean As You Code approach emphasizes focusing on issues in recently changed code, helping you to catch and fix errors before they become entrenched.
To help you focus on recently changed code, the main branch summary displays a specific tab for New Code quality measures (4, below).
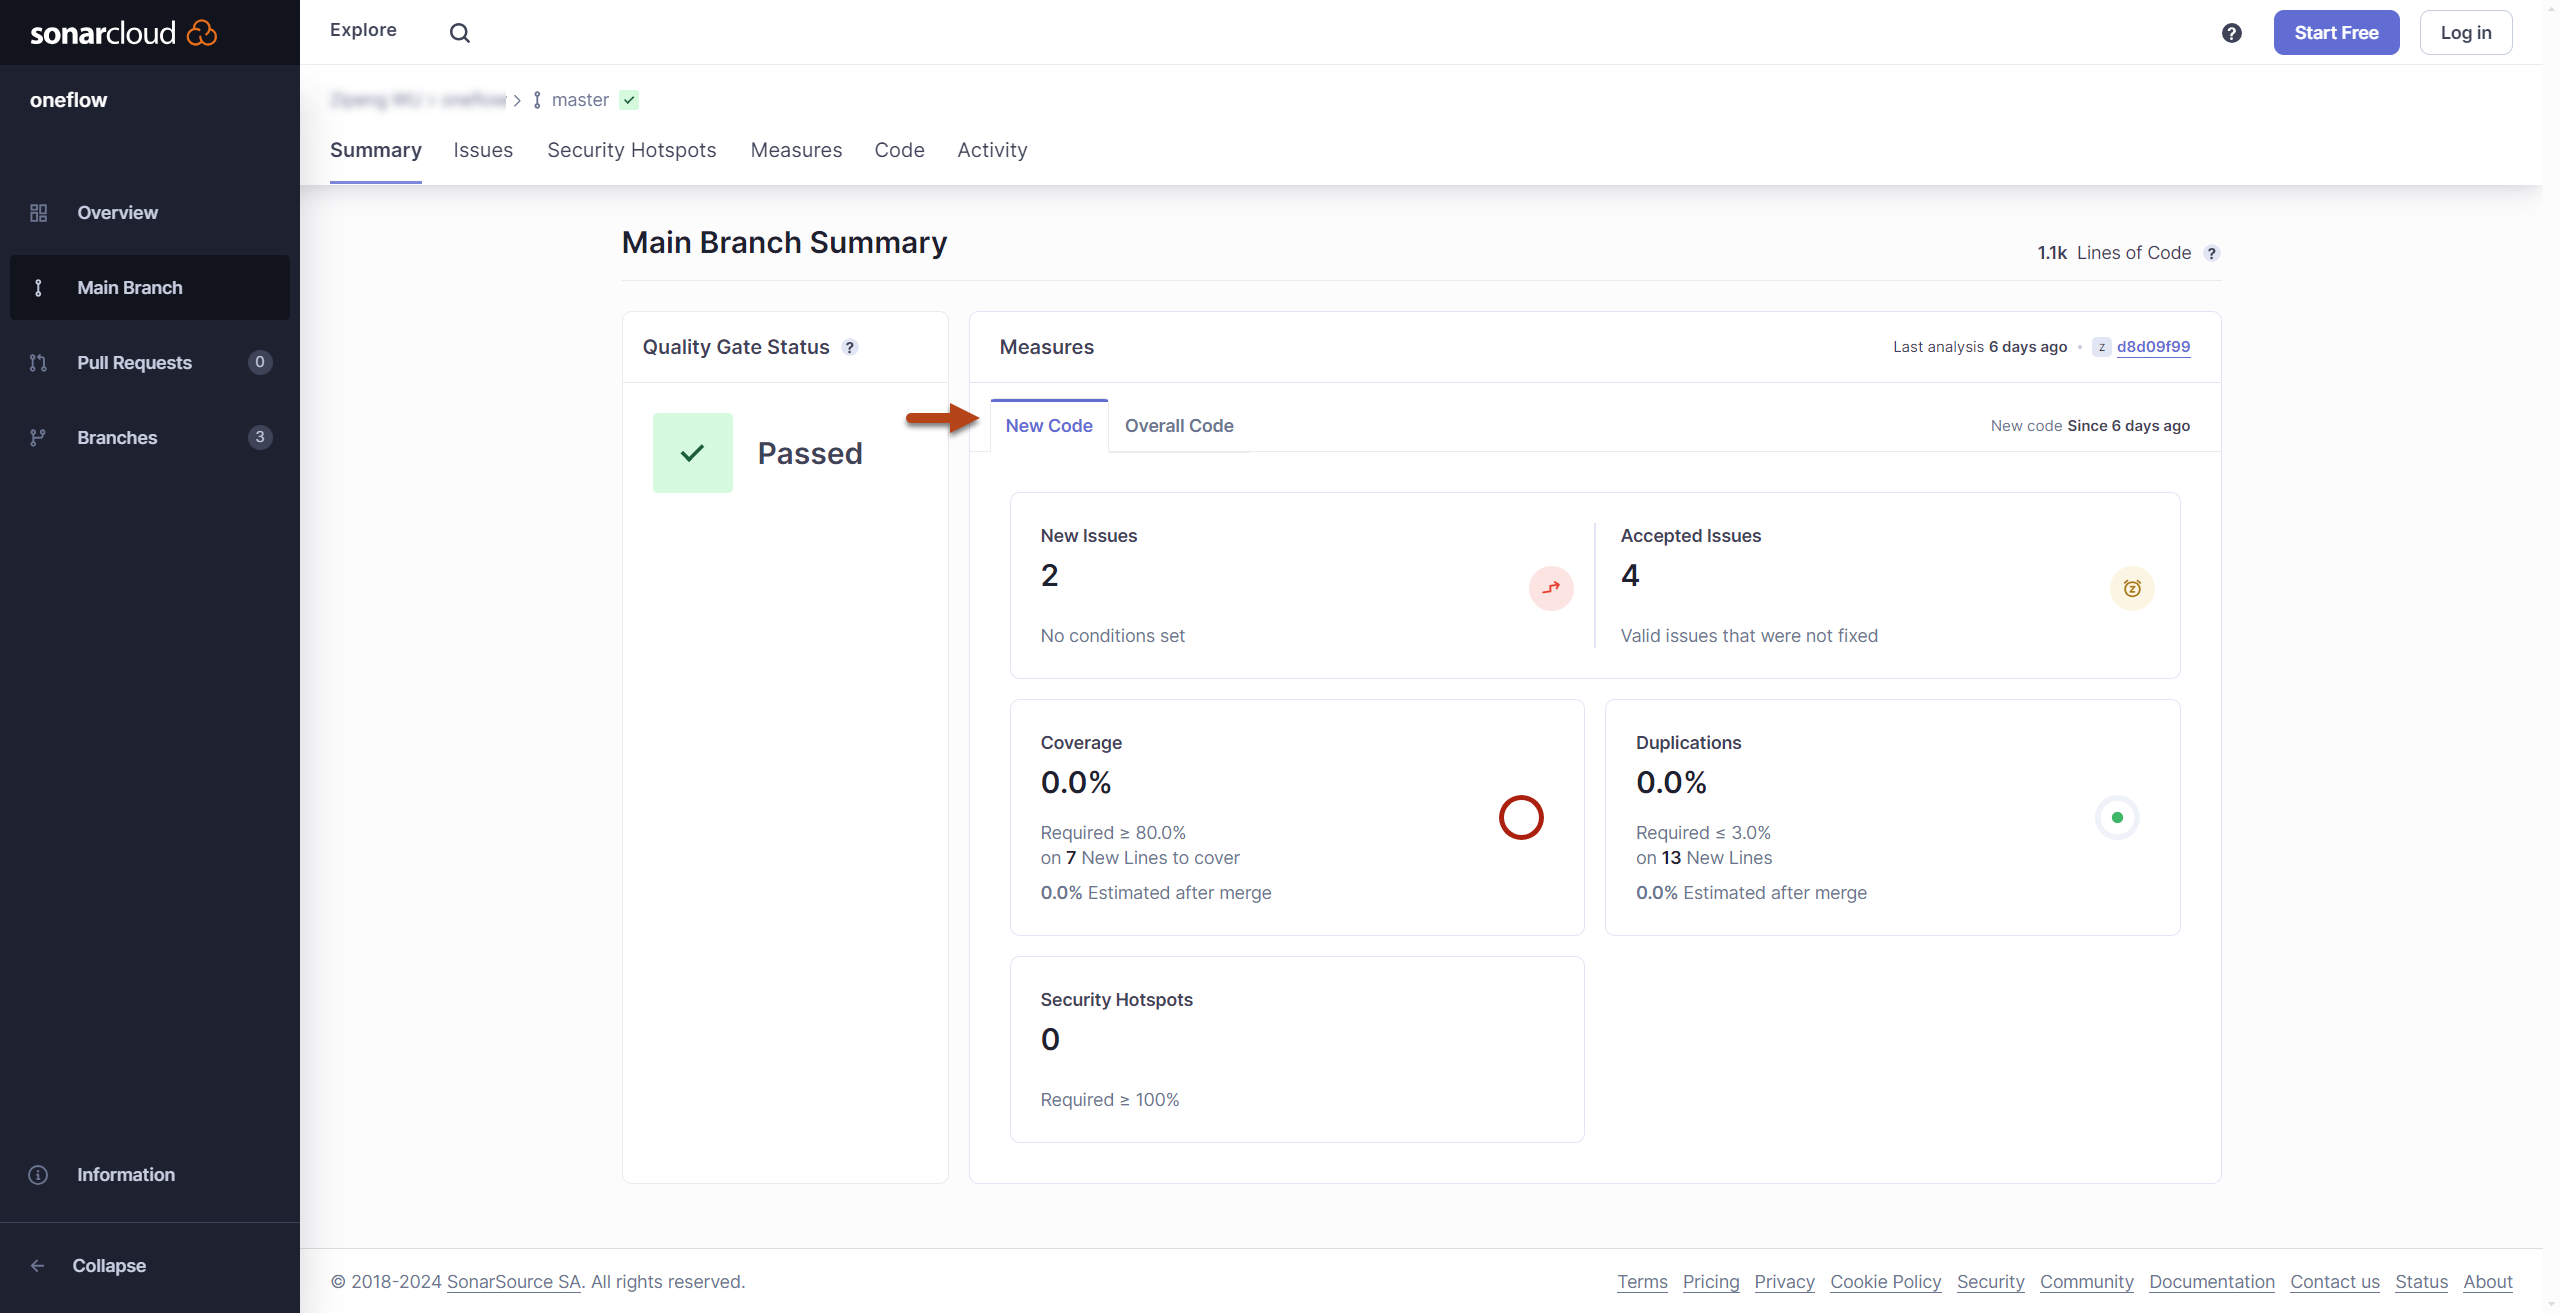
Note that the new code quality measures (and any quality gate that relies on them, like the default quality gate) will only appear upon the second analysis performed after a new code definition has been set.
Overall code quality measures
In addition to new code quality measures, the main branch summary also displays the Overall Code quality measures in another tab. This tab shows the issues found in all code, including new code. This information is helpful but usually of secondary importance when employing the clean as you code methodology.
Measures categories
The measures themselves are displayed as tiles corresponding to the following categories:
- Reliability: Details of issues with an impact on the reliability of your software.
- Maintainability: Details of issues with an impact on the maintainability of your software.
- Security: Details of issues with an impact on the security of your software.
- Accepted issues: Accepted issues. See the issues lifecycle section for more details.
- Coverage: Displays the percentage of potentially testable lines of code that are actually covered by test cases. The lines of code that could be covered are referred to as the lines to cover. Of those lines to cover, those that are currently not covered are referred to as the uncovered lines. The coverage percentage calculation is, therefore:
coverage = 100 - (100 * uncovered_lines / lines_to_cover). Note that lines to cover only counts lines that are included in the coverage report and testable (for example, lines that are only composed of}are not counted). This differs from how duplicated lines are counted. For more details see Test coverage. - Duplications: Identical lines of code detected. All lines of code into account (including non-testable lines). Since this differs from how coverage lines are counted, the final count for the two metrics may differ.
- Security Hotspots: Security-sensitive hotspots needing review.
Clicking on any figure takes you to a more detailed view, either in the Measures tab or the Issues tab.
Other tabs
Your Project > Main Branch > Issues
- The Issues tab provides an overview of all the issues detected by the analysis and lets you filter the list by adjusting the facets on the left.
Your Project > Main Branch > Security Hotspots
- The Security Hotspots tab provides information on detected security hotspots.
Your Project > Main Branch > Measures
- The Measures tab shows all project metrics. Choose a measure for more details. Both list and tree views are available for each measure, and tree maps are available for percentages and ratings.
Your Project > Main Branch > Code
- The Code tab takes you to an outline of your project structure. Drill down to see files in a directory, and choose a file to see its code. If your project is too large for easy exploration via drilling down, the search feature on this page lets you search within the files and directories in the current project.
Your Project > Main Branch > Activity
- The Activity tab takes you to the full list of code scans performed on your project since it was created in SonarCloud. Here you can follow the evolution of the quality gate, see the changes of quality profiles and find out when a given version of your code has been scanned.
Visualizations allow you to compare project components and quickly spot the ones that represent the most significant risks. Several predefined visualizations are available. You can also create custom ones with the metrics of your choice.
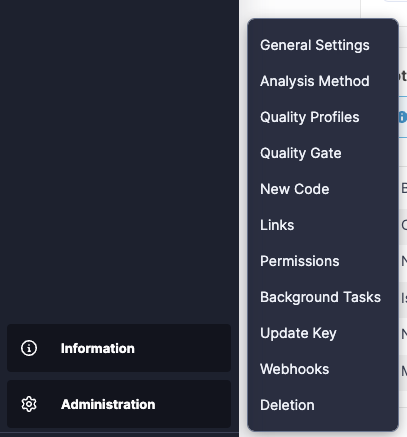
Your Project > Administration
- If you are a project administrator, the Administration menu gives you access to all project-level settings.
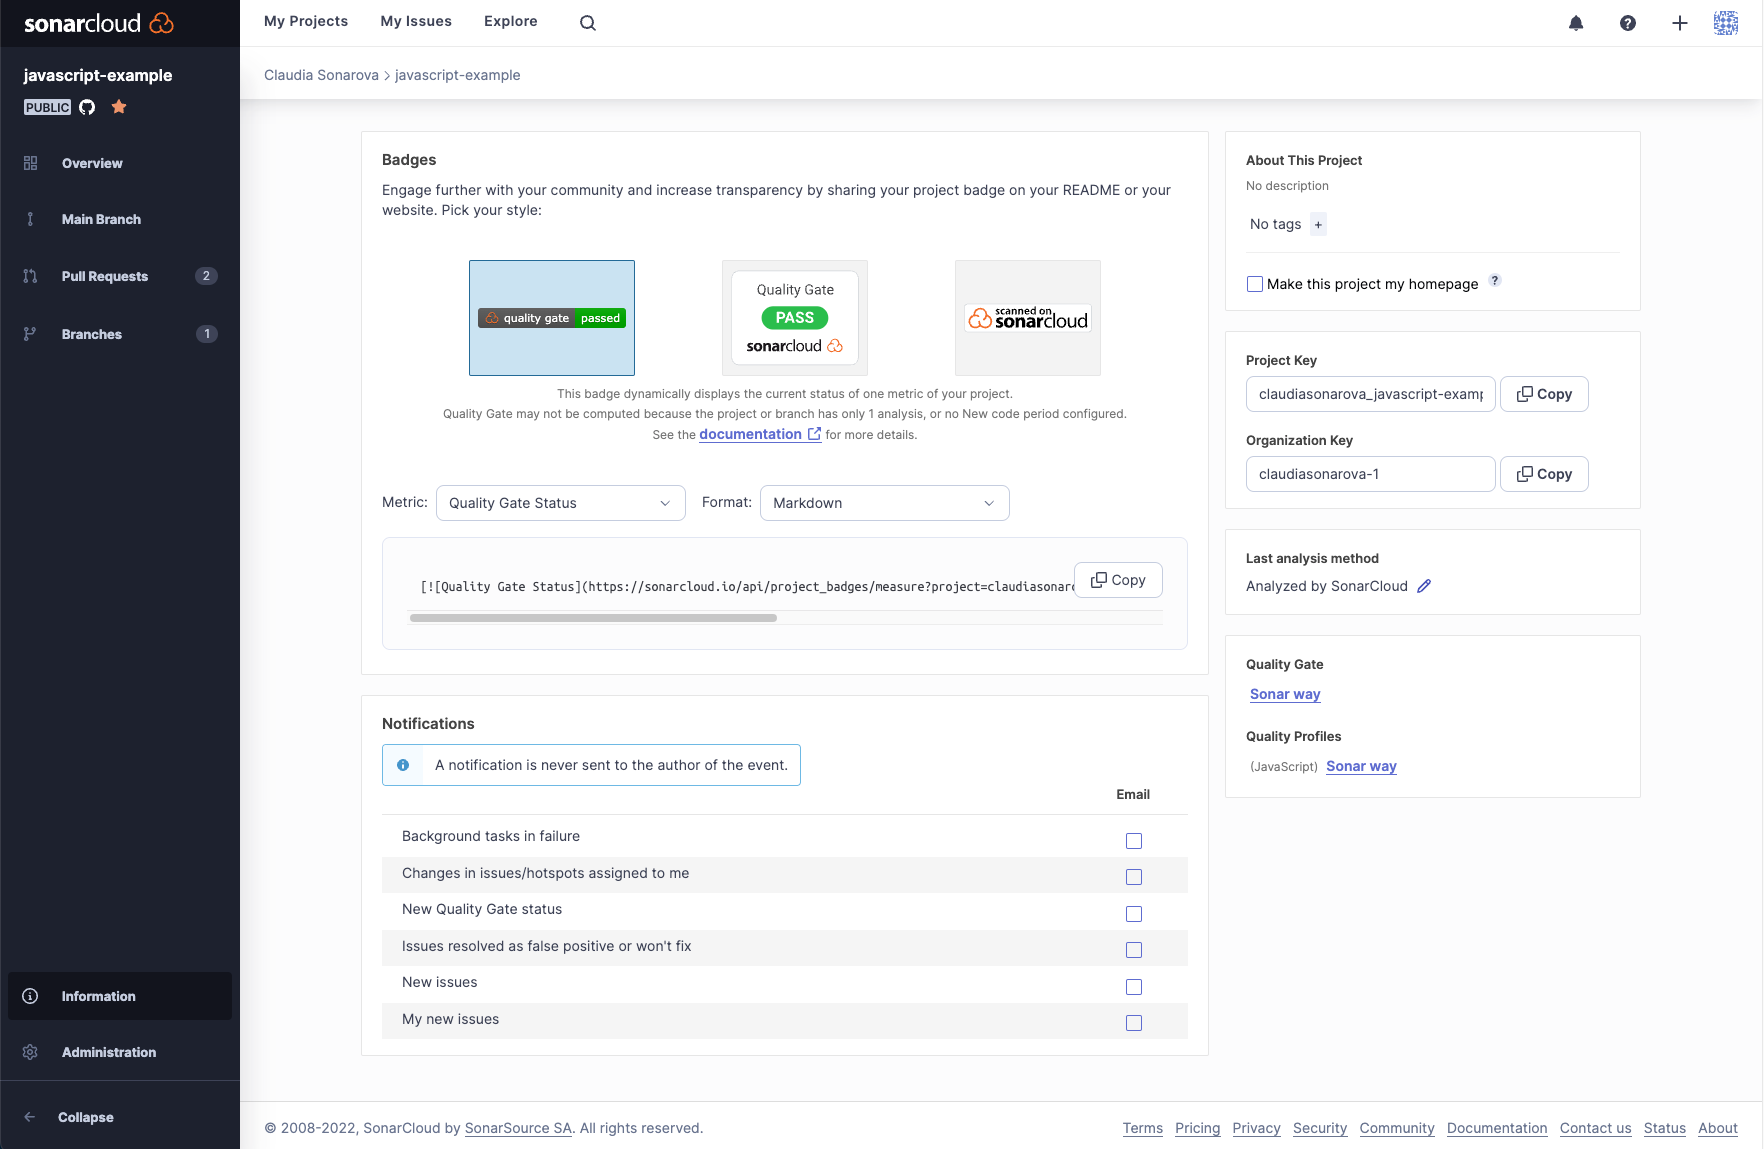
Your Project > Information
- The Information page provides additional details on various aspects of your project.
Other analysis views
In this section, we looked at how the results of Main Branch analysis are displayed. In addition, you can also access the analysis results of Pull Requests and other Branches through the project navigation on the left side of the screen.
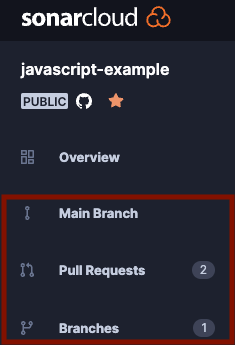
For details on these topics see the Branch analysis and Pull request analysis sections.